Doug Lane

SQL Server Entertainer

  • GitHub
  • LinkedIn
  • Twitter
  • YouTube
  • Blog
  • About Doug

Fit Chart Labels Perfectly in Reporting Services using Two Powerful Properties

February 19, 2013 by Doug Lane

Labels that refuse to fit along a chart axis are one of the most frustrating problems to deal with in Reporting Services. When trying to make them fit, we have a few basic options:

  1. Make the chart bigger.
  2. Make the labels smaller.
  3. Move or remove the labels.

Option #1 gets ruled out frequently for information-dense layouts like dashboards. Option #2 can only be used to a point; fonts become too difficult to read below 6pt (even 7pt font can be taxing to the eyes). Option #3 – angled/staggered/omitted labels – simply may not meet our needs. Are we out of options, then?

Not yet. There’s one more option when our labels refuse to fit.

  1. Give white space back to the objects inside the chart.

When I first started creating reports, I spent hours and hours trying to nudge objects this way and that. I grew them and shrunk them, trying to get everything to fit just right. Then I found out I could reclaim white space to use for labels and chart space. It was a game changer, turning hours of flailing through properties into minutes of educated guesswork.

A classic example of borrowing some white space is a twelve-month chart. Standard English month abbreviations are three or four characters long. Unfortunately, this happens a lot:

CIPP_D
Looks like another lunch at my desk while I fix this. Thanks a lot, May.

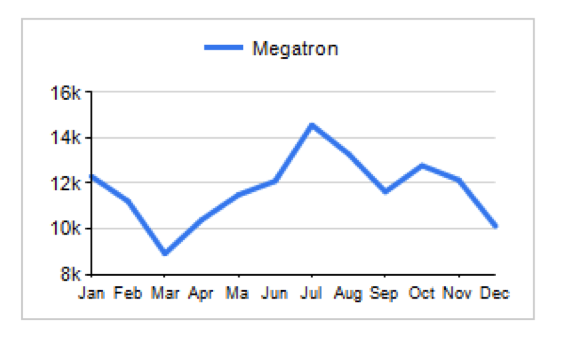
We’re so, so close to making it all fit. I’ll bet we can make it work if we just borrow a little white space.

(Besides, we don’t want Megatron to vaporize one of the lesser Decepticons down in Accounting over this; he’s very temperamental about his sales reports.)

In the properties window (F4 is the shortcut key for that) and click in the chart area, we’ll see two subheadings under Position that are collapsed by default. These are our two new best friends: CustomInnerPlotPosition and CustomPosition. Expanded, they reveal this:


The two properties that will save you hours of nudging and noodling.
The two properties that will save you hours of nudging and noodling by making you spend minutes nudging and noodling.

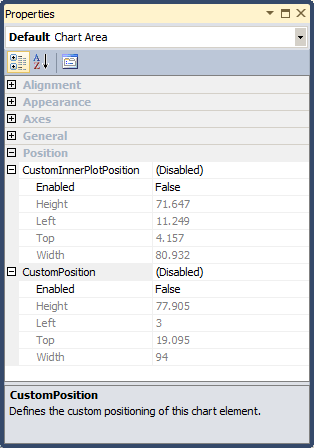
The window says they’re disabled, but that’s not really true. Rather, our chart is using the default values listed under the Height-Left-Top-Width settings. What do these numbers mean, and what’s the difference between the CustomInnerPlotPosition and CustomPosition properties? Let’s look at a picture (we’re visualization people, right?)

The three chart parts: Chart, Chart Area, and Inner Plot Area

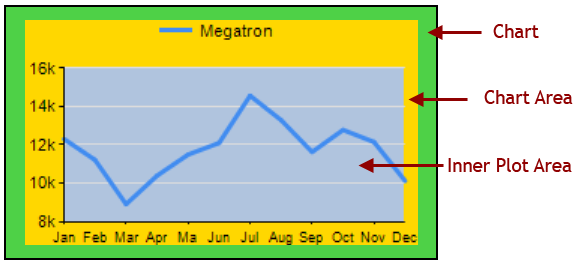
The chart object is made up of three distinct areas:

  • Inner Plot Area: contains all the plotted visuals, e.g., bars, lines, points
  • Chart Area: contains the Inner Plot Area + axis labels
  • Chart: contains the Chart Area + titles, legends, and white space

Note: Unfortunately, when you’re designing reports in BIDS or SSDT, there’s no reference to an “Inner Plot Area”. Instead it’s called the Chart Area. What we’re calling “Chart Area” in this article has no referential equivalent in the report designer.

Now that we know what the chart parts are, let’s look at the chart with the CP/CIPP numbers together.

Chart with its default CustomPosition and CustomInnerPlotPosition values.

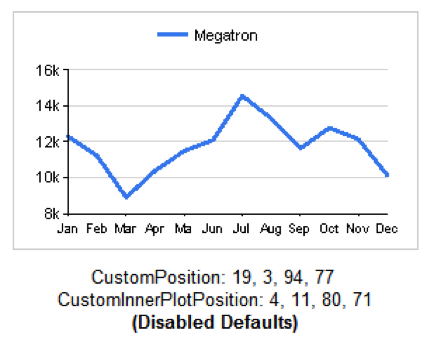
The numbers for each property are actually percentages, from 0-100, and relate to the object in which they are contained. This means, in English:

  • The Chart Area
    • Begins (percentage-wise) 19% from the top edge of the Chart
    • Begins 3% from the left edge of the Chart
    • Spans 94% of the Chart width
    • Spans 77% of the Chart height
  • The Inner Plot Area
    • Begins (percentage-wise) 4% from the top edge of the Chart Area
    • Begins 11% from the left edge of the Chart Area
    • Spans 80% of the Chart Area width
    • Spans 71% of the Chart Area height

Two important points to make, then we’ll get on to fixing our labels (I promise):

  1. Because the CustomInnerPlotPosition numbers are in relation to the Chart Area and the numbers are on a scale of 0-100, we cannot grow the Inner Plot Area beyond the edges of the Chart Area.
  2. The Chart and Inner Plot Area + Chart Area exist on separate Z-axes. In other words, they overlap visually. When you really need to pack objects like the legend and chart title in tightly, use this to your advantage.

Okay, let’s see the properties in action. We’ve seen the defaults when they’re disabled. Here are some other values and the visuals they produce:

Maxed out 
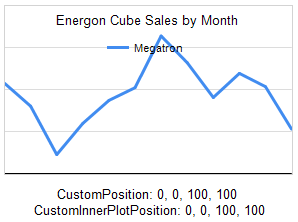
We’ve maxed-out both properties here. The Inner Plot Area is given 100% of the Chart Area, and the Chart Area is given 100% of the Chart as a whole. Therefor, the Inner Plot Area occupies the entire chart and leaves no room for the axis labels. Note, however, the overlapping layers with the Chart contents on top of the Inner Plot Area contents.We’ve got a title on this graph only, just to see how it bumps the legend down. It has no effect on the Inner Plot Area or the Chart Area.
CIPP7 
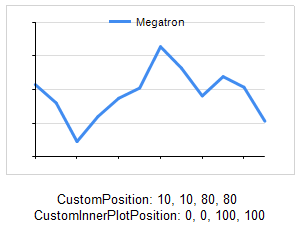
This time we give the chart a little white space around the edges but everything inside of that belongs to the Inner Plot Area. Again, we haven’t left sufficient room to render any axis labels (they’re not turned off).
CIPP_A 
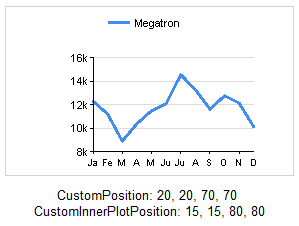
A little too far in the other direction, we only allocated 70% of the chart to the Chart Area, and only 80% of that space (56% for the non-math majors out there) is used for drawing the Inner Plot Area. Not surprisingly, our labels are really smashed together. If you need extra space for a legend or a background image, this is how to get it.

Now that we understand what the numbers do, it’s a matter of experimentation – finding out what numbers work to get us the results we want. In this case, we don’t care about titles for the chart or axes. We just want the axis labels to fit.

After some fiddling with the numbers, here is our winner:

Ding ding ding ding! We have a winner!
If you were lucky, it only took you six minutes to get this right.

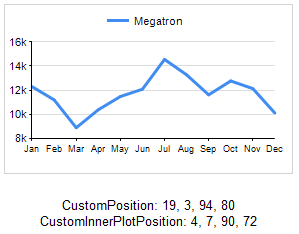
Laserbeak and Vortex down in Accounting will be relieved!

CustomPosition and CustomInnerPlotPosition can save you a great deal of frustration when dealing with small or dense graphs. They aren’t complex properties, but they aren’t well documented either — even by Microsoft. They’re indispensible enough that I hope they make their way into Power View (which employs generous buffers of white space).

I’ll throw this out too: labels and legends also have a CustomPosition property. Enjoy!

I hope by knowing these properties, you’ll be well equipped to deal with labels and legends that stubbornly refuse to display correctly. Will these properties save you time and agony? Do you have another trick for squeezing labels into place? Let me know in the comments!


Filed Under: Reporting Services Tagged With: Charts, CustomInnerPlotPosition, CustomPosition, Labels

The Group In Which We Are The Norm

October 30, 2012 by Doug Lane

Early this year, I stumbled on to a blog post by author and speaker Simon Sinek. In his post entitled “Fitting In“, he writes about his experience at Comic Con — how it made him realize the lengths to which we’ll go to fit in, and why trying hard to fit in isn’t a good strategy. I read the post and right away began to think of how this relates to the SQL Server community.

The 2012 PASS Summit begins next week and if you’re a first-time attendee, it’ll probably be your first immersion into the SQL Community. You may find yourself trying to look or act a certain way to try to fit in. Don’t. Resist the urge, the fear that tells you you have to conform. Sinek says rather than working to fit into some group, work to find the group in which you already fit. Many people — myself included — have found that the SQL Server community is a group in which we already fit. We all love working with SQL Server and we love data. If we didn’t, we wouldn’t commit to 3-5 days of intense learning about it. We can reason therefore, the people you’ll meet next week are as serious and dedicated to their work as you are.

Of course, we have different interests outside of SQL Server, but when you find someone who shares one of those interests, it makes your common bond that much stronger. For example, I’m a fan of film scores and composers like Jerry Goldsmith, James Horner, and Michael Giacchino. It happens that Mike Fal (b | t) is also a fan of that same subject. Discussing film scores is how Mike and I became friends. Allen White (b | t) and I talk about show tunes, Jes Borland (b | t) and I talk about running, and Steve Jones (b | t) and I play baseball together. None of that would have happened if I didn’t put myself out there and share my outside interests with others.

(Also, there are a lot of people who like Star Trek.)

(You’ll see.)

I let some of my personality show at the Summit last year but still held back for fear of rejection or not fitting in. This year, I’m going to fearlessly be me and it’s going to be wonderful. I suggest you do the same. Be yourself. Be comfortable. This is, as Sinek says, the group in which you are the norm.

A Word About SQL Karaoke

From what I’ve seen, karaoke at the PASS Summit has blown up to a much bigger deal this year. If you’re a first-timer, you may wonder if the singing is competitive or only for the talented. It’s not. It’s just really fun and really popular. If you can’t carry a tune very well, don’t worry. Neither can I. Just enjoy yourself whether you decide to sing or not. That’s the whole point anyway.

See you in Seattle, my friends.


Filed Under: Career, PASS Summit

SQL Saturday #169 – What to do when it’s just you

September 18, 2012 by Doug Lane

Are you the only one doing what you do where you work? When people have technical questions — particularly about data — do they come to you and only you? When you’re stuck on a code or architecture issue, is it solely up to you to figure it out? If so, keep reading.

(If not, why not just keep reading anyway?)

It just feels that way sometimes.

I’ll be presenting at this weekend’s SQL Saturday here in Denver and in a refreshing break from the norm, I won’t be talking about Reporting Services. Instead, I’ll be leading a professional development panel discussion on surviving and thriving as the only technical resource at your company. I call it, “What To Do When It’s Just You.” I’ve spent the last eleven years as the only developer doing what I do. Along the way, I’ve learned better ways of managing time and expectations, solving problems, and recognizing when you’re going to burn out.

However, it won’t be just me giving my own advice on these topics. Also sharing their insight will be Carlos Bossy (t | b), independent BI consultant; Mike Fal (t | b), DBA and blogger; and Glenn Berry (t | b), SQL Server MVP and Principal Consultant at SQL Skills.

Carlos, Mike, Glenn, and I delivered this same session at the Denver SQL User Group meeting back in May.  Here are a few comments we got on our event forms:

“I almost feel like those guys could talk for the entire meeting and it would still be valuable.”

“Good insight into solo gigs. Great tips!”

“[This] presentation was one of the best the [Denver User] group has done.”

“Loved the discussion panel!”

If you haven’t signed up to attend SQL Saturday, there’s still time! If you’re already signed up, I hope to see you at our session.

Filed Under: Career, SQL Saturday

A Conversation About Abstracts Between Committee Me and Rejected Me

June 7, 2012 by Doug Lane

Last year, I submitted abstracts to the PASS Summit for the first time. I sent in four abstracts and all four were rejected outright. I took the rejection pretty hard, especially considering all four were rejected for no other stated reason than “max sessions allocated for track” — in other words, simply not good enough. This year, I served on the abstract review committee for the AppDev track. I not only wanted to serve the SQL Server community in this way, but I also sought a better understanding of how abstracts are selected, and what makes an abstract a winner. To ease the sting to those who are going to be rejected for this year’s Summit (or were rejected in years past), I thought I’d share with you a conversation between last year’s me (the rejected applicant) and this year’s me (the committee member).

Rejected Me: I suppose you know why I’m here.

Committee Me: First, let me tell you, very sincerely, I’m sorry you didn’t have any abstracts selected this year.

"Well, we still have the call for Lightning Talks."

Rejected Me: Thanks, but I’m still pissed about it.

Committee Me: I understand. I’ve been there. I wasn’t on your track’s committee, so can you tell me your reasons for rejection? Maybe I can help you understand.

Rejected Me: I don’t know, all they said were “Max sessions allocated”.

Committee Me: That just means you wrote adequate abstracts, didn’t leave anything incomplete, that sort of thing.

Rejected Me: Duh. I was thorough. I spellchecked and filled in all the required info.

Committee Me: It also means, for whatever reason, all the accepts and alternates were better than yours in the eyes of the committee.

Rejected Me: Can’t they tell me more than that?

Committee Me: I know it stinks not getting better feedback, but keep this in mind: three volunteers took time to evaluate as many as over 200 abstracts. Most of them are complete and halfway well-written. They don’t have time to give full critiques to each one.

Rejected Me: But that doesn’t help me. How will I know what I need to do better next time?

Committee Me: I don’t want to sound harsh, but it’s not their job to counsel you on why they didn’t like your abstracts more. Read the abstracts that were accepted and you’ll see commonalities. Learn from those.

Rejected Me: Fine. But why does [this person] always get to speak? Why not let some new people get a chance?

Committee Me: It just so happens that experienced speakers tend to be experienced abstract writers. Like I said, learn from the successful ones.

Rejected Me: I submitted three of my four abstracts in the same subject area. Surely they could have picked one of them.

Committee Me: Not necessarily. It could be they thought the target audience would be too small, or they already had it covered by another abstract — one that was better written.

Rejected Me: Is it me? Maybe my abstracts weren’t the problem.

Committee Me: Could be. Your experience does factor in, but we do want some newer speakers in there too. How many events have you presented at before you submitted to the Summit?

Rejected Me: Two.

Committee Me: Hmmm, that’s not many. Did you do well at those events?

Rejected Me: My feedback was good, so I don’t think I’ve got a bad reputation.

Committee Me: Certainly no reputation is better than a bad one, but neither case is very helpful. Keep speaking when you can find the opportunity. You’ll be much more established by this time next year, and that can only help.

Rejected Me: I suppose.

Committee Me: Try to remember this is the world’s largest SQL Server conference and the people that speak here have earned their way up on stage by building a history of successful presentations and writing good abstracts. Hang in there. Work to improve your content, delivery, and abstract writing, and you’ll get the call eventually.

Rejected Me: Thanks. But why didn’t they like my abstracts this time?

Committee Me: Well, if it’s any consolation, it could be someone on the committee really liked one, but it wasn’t enough to float it up high enough to make the cut. So it may not have been unanimously rejected. Apart from that, I don’t know what else to say except I’ve been in your shoes. I know exactly what you’re feeling.

Rejected Me: I don’t even know how close I came. Can’t they publish the final rankings or comments?

Committee Me: That’s an interesting idea, but one with a lot of complications. First, this is done by committee, so it could be one member writes glowing comments but the other two rate it low enough that it doesn’t make the cut. You end up with great comments and a lower ranking. To me, contradictory feedback is worse than no feedback. Another problem is that we simply don’t have time to comment specifically on each abstract. It’s hard enough to try to rate them all fairly. I even went so far as to make sure I wasn’t hungry, tired, or mad about something before reviewing a chunk of abstracts because I wanted to be in an equal frame of mind across them all. (Proof there’s a rational basis for doing so.) Also, if we posted complete rankings, we’d get a lot more questions from people wanting to know why they were ranked so low. It’s the committee’s job to rank abstracts, not to publicly defend the rankings. Sorry.

Rejected Me: This still sucks.

Committee Me: Yes. Yes, it does. I hope I’ve helped a little.

Rejected Me: A little.

I hope I’ve helped a little. Hang in there.

Filed Under: PASS Summit, Presenting

When Your MacBook Won’t Detect a Projector

June 1, 2012 by Doug Lane

Experiencing a major technological disaster is a rite of passage among presenters. At SQL Saturday in Madison, I had my first presentation laptop failure. Surprisingly, it happened with my MacBook Air. (I’ve had two MacBooks with zero problems, versus three HPs with a combined twelve hardware failures.)
 
With ten minutes to go before my presentation, I could not get the laptop to recognize the projector. I checked and re-checked the cable, the DisplayPort<->VGA adapter, restarted both projector and laptop. A few other speakers tried to help, as did the room monitor. Five minutes into my session time, I plugged in a copy I had on a USB drive to the room’s PC and began my presentation. Not long after, the IT person in charge that day took my laptop to another room to see if he could get signal there. He couldn’t. I continued on, blowing past the three VM-based demos I had lined up. Fortunately, the presentation went well enough without the demos.

"If it were an HDMI connection, I would have found it hours ago."
Last week, I finally took the laptop down to the Apple Store and got some answers. What happened? In short, the chunk of memory that stores information about display connections became corrupt. With about sixty seconds of work, the guy at the Genius Bar got it to recognize both Apple and generic VGA monitors. Here’s what he did to clear the memory.
 
First, he reset what he called the Power Management Unit (PMU) using these steps:
  1. Shut down the computer.
  2. Connect it to AC power.
  3. Press the left shift + command + option + power button.
Second, he reset the Parameter RAM (PRAM) on the computer using these steps:
  1. Shut down the computer.
  2. Press the power button to turn on the computer.
  3. Immediately, before the gray screen appears, press and hold command + option + P + R. Hold the keys down until the machine restarts and you hear the second startup sound.
If your MacBook ever refuses to recognize a projector or VGA connection and you’ve tried everything you can think of, try resetting the PRAM. It may save you from having to dismember your presentation at the last minute.
 
You can find a little more about PRAM here:

http://docs.info.apple.com/article.html?path=Mac/10.6/en/26871.html

http://support.apple.com/kb/PH4405

Filed Under: Presenting Tagged With: DisplayPort, MacBook, PRAM, projector, troubleshooting

  • « Previous Page
  • 1
  • 2
  • 3
  • 4
  • 5
  • …
  • 8
  • Next Page »

Subscribe now!

Don't miss new posts as they publish. Enter your e-mail address to subscribe!

Your e-mail address will stay quietly between us, like that time I set the carpet on fire by accident.

Copyright © 2025 · Outreach Pro on Genesis Framework · WordPress · Log in